
Malcomb et al Reanalysis
Malcomb et al 1 attempt to produce a climate vulnerability model for the nation of Malawi using a variety of indicators, and we aimed to reproduce this study using an R markdown notebook methodology. While Malcomb et al describe their model as static and rooted in empirical evidence, there is little to no documentation of their methodology for picking and weighting indicators other than writing that interviews were conducted with subject experts. From our perspective, this was a significant source of uncertainty in the study model.
One piece of the study that I chose to examine was the differentiation between use of vector and raster data types. While for much of the study Malcomb et al describe their research at the spatial scale of Traditional Authorities in Malawi. However, the final piece of their analysis produces a raster grid of the whole nation representing vulnerability score according to their model. This map had no Traditional Authority boundaries on it and the units were simply pixels of an unknown scale because they resulted from some of the physical risk data coming in raster format. Due to this complication, I decided to aim to make the final output of the model a map of the vulnerability model scores, but in a more meaningful unit. My contribution to this reanalysis study was to calculate a zonal statistic of vulnerability for each Traditional Authority across Malawi. I then mapped this new statistic with Traditional Authority boundaries. This allows the user to see the vulnerability scores in the unit that the authors discuss most directly as a significant unit of analysis.
The original raster map: 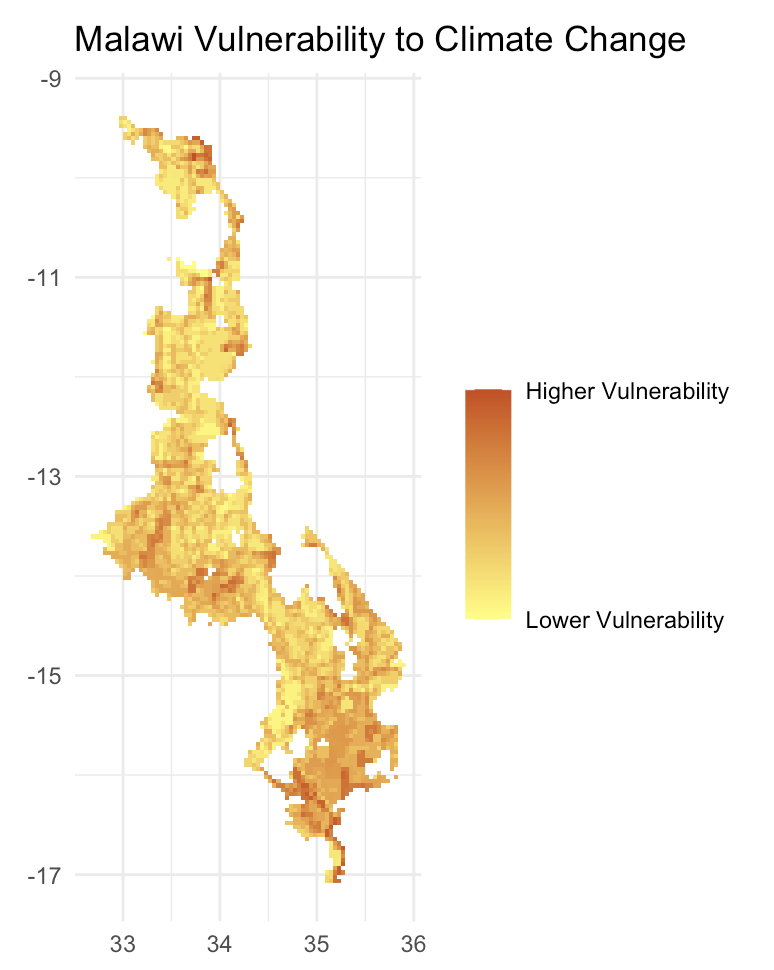
My map based on zonal statistics: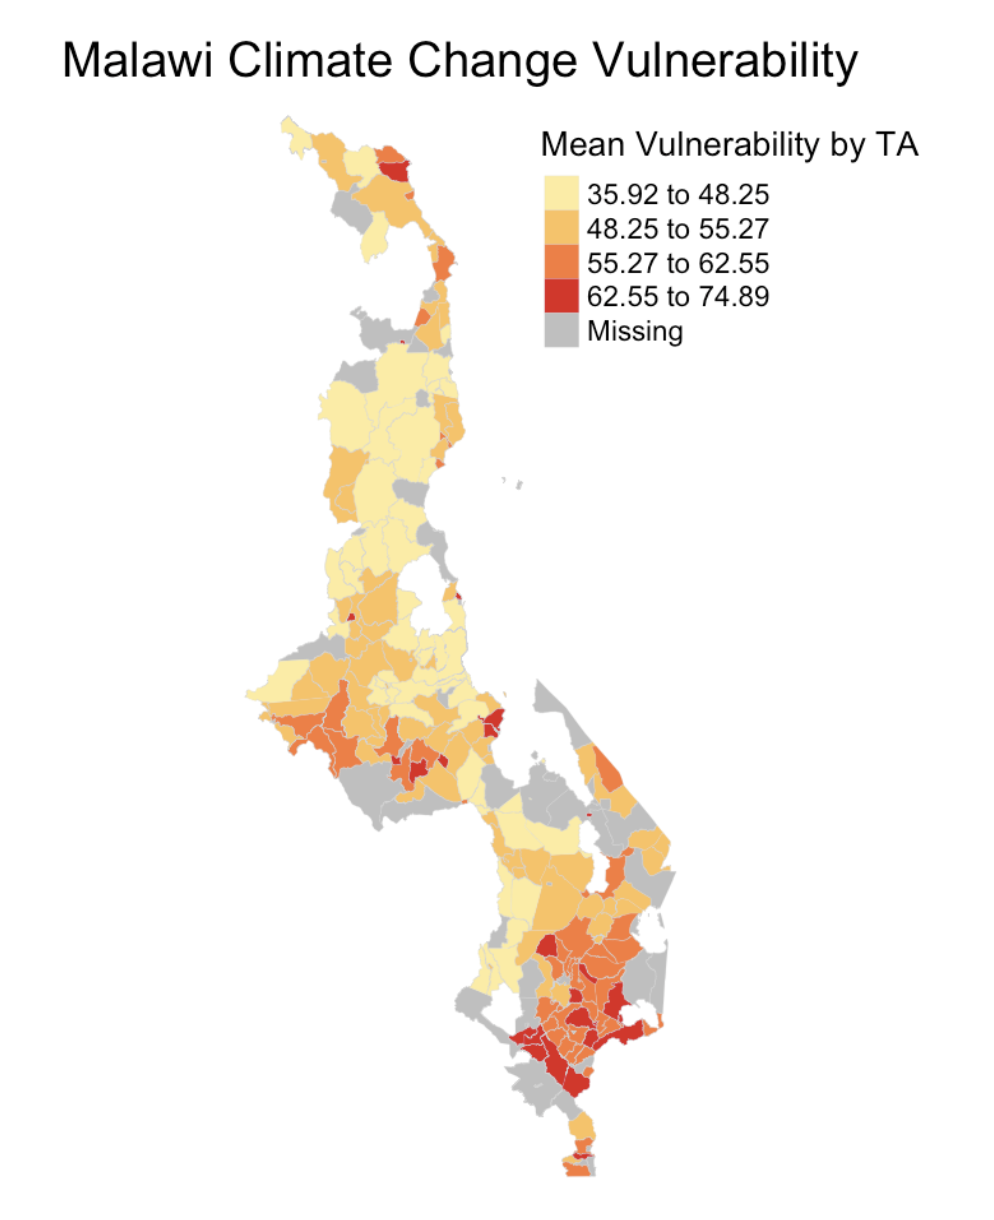
Link to full report
Link to full repository
-
Malcomb, D. W., E. A. Weaver, and A. R. Krakowka. 2014. Vulnerability modeling for sub-Saharan Africa: An operationalized approach in Malawi. Applied Geography 48:17–30. DOI:10.1016/j.apgeog.2014.01.004 ↩